
How much water and electricity does #genAI actually use?
The
data is more nuanced (and contradictory) than the headlines.
"If you’ve seen a few charts estimating the energy impact of putting a question to an AI model, you might think it’s like measuring a car’s fuel economy or a dishwasher’s energy rating: a knowable value with a shared methodology for calculating it. You’d be wrong.
In reality, the type and size of the model, the type of output you’re generating, and countless variables beyond your control—like which energy grid is connected to the data center your request is sent to and what time of day it’s processed—can make one query thousands of times more energy-intensive and emissions-producing than another.
And when you query most AI models, whether on your phone within an app like Instagram or on the web interface for ChatGPT, much of what happens after your question is routed to a data center remains a secret."
— O’Donnell, James, and Casey Crownhart. 2025. “We Did the Math on AI’s Energy Footprint. Here’s the Story You Haven’t Heard.” MIT Technology Review.
You're right that emissions are up double digits at every AI hyperscaler. You're right that two-thirds of new US data centres sit in water-stressed counties . You're right that nobody — not OpenAI, not Anthropic — discloses video, reasoning, or agentic footprints. None of that is denied here; all of it is cited below.
But you may not know: the per-use numbers, now measured and audited rather than guessed, are far lower than the meme numbers — a year of chatting costs less carbon than one tank of gas (chart), and less water than one hamburger (see the water section). The strongest version of your concern is not about anyone's prompts; it is about siting, gas turbines, and disclosure — and that version is stronger, because it's the one the data supports (aggregate section, extrapolation).
(1) Google's absolute emissions: +51% vs 2019 despite 33× per-prompt efficiency gains — Jevons' paradox operating as written (Google ER 2025). (2) Bloomberg 2025: ~⅔ of new US data centres since 2022 in high water-stress regions. (3) Disclosure census: of all frontier labs, exactly two (Google, Mistral) have published audited per-prompt footprints (Luccioni 2025).
You're right that the "bottle of water per email" meme is off by up to three orders of magnitude against measured data. You're right that a year of heavy chatbot use emits less than one tank of gasoline and sips less water than one burger embeds. You're right that US golf courses out-consume the entire US data-centre industry's direct water draw thirty-fold. All cited below.
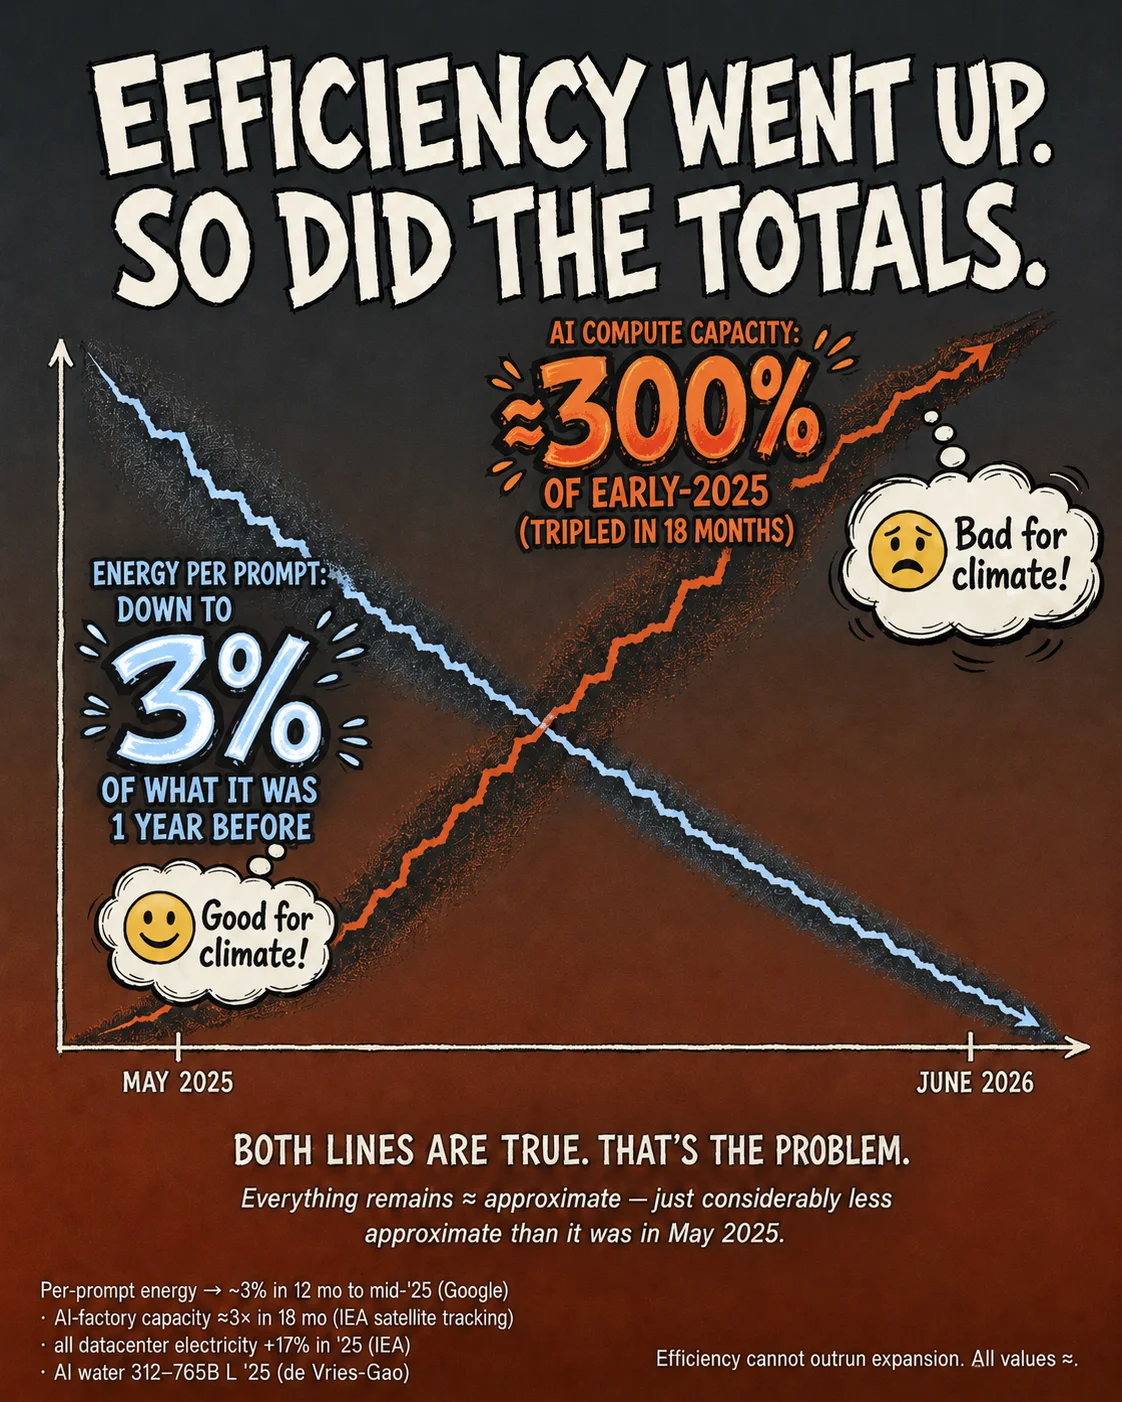
The part you may not expect: per-use triviality does not scale to aggregate innocence. Data-centre demand grew 17% in 2025 on real meters; gas-turbine orders are at a 25-year high; hyperscaler emissions are rising faster than their efficiency gains; and the exponential growth of #genAI use (video: ~680 kWh per generated hour) is the pattern we need to watch (extrapolation section). "Trivial per-use, consequential in aggregate" is how automobiles looked in 1926.
(1) 2025 metered growth: +17% data-centre electricity, AI factories tripling in 18 months (IEA). (2) One hour of AI-generated video ≈ 140–300 kg CO₂e ≈ a year of measured-heavy agentic coding (MIT TR 2025). (3) 15–27 GW of on-site gas projected for US data centres by 2030 (IEA).
SEEING IS BELIEVING: try the Comparator below.
All values based on real 2026 data. Sources
listed
at end of this article.
AI categories — full-chain accounting, deliberately the HIGH end: every AI
number in this comparator uses the highest independently calculated full-chain reading — the ceiling, not the
typical value: chat 1.2 Wh and 45 mL per
query (Jegham '25 benchmark; Mistral ADEME-audited full lifecycle); reasoning 30 Wh; image 3 Wh (Luccioni
FAccT '24); video 678 kWh/hour (MIT TR '25, measured at 0.94 kWh per 5-second clip; an independent cost-based
estimate of Sora-2 video, Alexander '26, ~0.94 kWh and ~4 L per 10-second clip, is consistent with
this); coding 1,000 Wh per
active hour (autonomous-harness outlier, Couch '26); carbon 0.4 kg CO₂e/kWh (US location-based grid, EPA
eGRID); water 5 L/kWh including electricity-embedded water (Macknick '12 / Ren '25). Provider-measured
on-site values are a small fraction of these — chat 0.24 Wh and 0.26 mL (Google '25 median), coding 130
Wh/hr measured, carbon 0.125 kg/kWh, water 0.5 L/kWh — so the AI figures shown here are the ceiling; the
measured floor runs roughly 5–100× lower depending on category (see Figure 0).
Non-AI categories: transatlantic round trip (one person) 2,900 kg CO₂e incl. RF×2 (atmosfair; water not
quantified here); hamburger ≈7 kg CO₂e (Poore & Nemecek '18) and 927 L water (SemiAnalysis '26); bath ≈265
L, 8-minute shower ≈64 L, WaterSense toilet flush ≈4.8 L (EPA — carbon not quantified: water-heating energy
varies too widely by home); driving 0.4 kg CO₂e/mile (EPA; water not quantified); golf round ≈0.7 kg CO₂e and
≈14,400 L irrigation (CarbonSave/GCSAA, USGA, ÷ ~30,000 rounds per course-year); soldier person-year ≈33,000
kg CO₂e (Crawford '19 / SGR-CEOBS '22; water not quantified). Bar scales (fixed): each carbon bar = one
car-year (4,600 kg, EPA); each water bar = 100,000 L (≈ 108 burgers ≈ 377 bathtubs); big values stack
additional bars. All values ≈.
Every camp in the AI-environment debate selects data estimates that flatter its thesis.
Before any comparison, note: all of these numbers are, within their own boundaries, correct.
All of these numbers are correct — inside their own boundaries. The chart shows not a disagreement about physics, but five different ways of answering the same questions.
In roughly descending order of effect. (1) Boundary scope: Google counts the on-site footprint of serving one prompt; Mistral counts a share of training, hardware manufacture, idle capacity, and upstream water — full-chain accounting is 10–100× wider by construction. (2) Median vs. mean: Google reports the median prompt; means are dragged upward by a heavy tail of long-context and reasoning queries (10–65× costlier). (3) Grid accounting: market-based figures credit purchased clean energy (Google's 0.03 g); location-based figures use the physical local grid (≈ 0.4 g for the same watt-hours on average US power). (4) Model size & tokens: a 400-token response from a large model is simply more computation than a median short reply from an efficiency-routed one. (5) Vintage: per-prompt energy fell ~33× in the twelve months to August 2025 — estimates dated eighteen months apart describe different machines. The honest takeaway: always ask which boundary, which statistic, which grid, which model, which year. This essay states all five for every figure it uses.
Generative AI exists within a complex web of human activities
that collectively impact our
climate.
A year ago this analysis depended on triangulated guesswork. Since then, the guesses got audited. Google
published
a measured methodology: the median Gemini Apps text prompt consumes 0.24 Wh of
electricity, emits 0.03 g CO₂e, and evaporates 0.26 mL of water — and its per-prompt energy fell
33× in twelve months (Google,
Aug 2025). Mistral released the first full ISO-compliant lifecycle analysis of a frontier model, audited
with the French ecological transition agency ADEME: 1.14 g CO₂e and 45 mL of water per
400-token response, full chain included (Mistral, Jul
2025). Epoch AI re-derived the old "3 Wh per ChatGPT query" meme from hardware first principles and found
it
tenfold too high: ~0.3 Wh (Epoch
AI, Feb 2025).
Re-running the 2025 essay's central comparison with measured data: daily ChatGPT-style usage now computes to
approximately 0.5–7 kg CO₂/year for moderate-heavy use (the 2025 draft
conservatively estimated 4–40 kg) — against a transatlantic round-trip flight (≈ 2.9 tonnes CO₂e), car ownership
(≈ 4.6 tonnes CO₂/year), Bitcoin (≈ 39.8
MtCO₂e in 2025 per Cambridge's
revised, survey-based estimate — down sharply from the 91.4 Mt model cited in 2025, as measured miner
energy
mixes proved 52.4% sustainable), and the military (the global military carbon footprint is estimated at
~2,750
MtCO₂e, ~5.5% of global emissions — SGR/CEOBS).
The social utility of war
(in an age of nuclear weapons)
remains zero.
Each full bar = one car-year (4,600 kg CO₂e, EPA); big values stack bars — the comparator's grammar. Dedicated AI is colored sienna. Rows whose values changed since May 2025 are marked UPDATED ▼/▲; rows added this year are marked NEW; unmarked rows are unchanged.
How to read the bars. Each full bar equals one car-year (4,600 kg CO₂e); larger values stack additional bars (the military row stacks 8.7). Bars are drawn at the top of each printed range, and every bar floors at a minimum visible width — trust the printed values, not the pixels. All rows are annual totals except the flight row, which is per round trip; the chatbot row is shown at 100 queries/day (≈1–15 kg/yr) and still renders at the floor, like streaming, despite streaming being ~3× larger.
What changed since May 2025. The chatbot row fell from ≈40 kg/yr to ≈0.5–7 kg/yr as measured disclosures and independent benchmarks replaced the training-amortised heuristic. The image-extreme top end fell from 1,100 to ≈430 kg/yr: the 2025 figure extrapolated a 3 g/image cost for SD-3.5-Large via an N1.4 scaling guess; measured FAccT data (≤2.9 Wh ≈ 1.2 g/image on average grids) replaced the guess. The Bitcoin network total was revised down by Cambridge (91.4 → 39.8 Mt); the per-rig heuristic stands. Two rows are new: agentic coding (the genuinely new heavy tail of 2025–26) and golf (carbon-modest, water-extreme — see the water chart below). Car, flight, dog, soldier: unchanged.
Global militaries ~2,750 (SGR/CEOBS '22) · aviation ~882 (OWID '24) · data centres excl. AI ~126 & AI systems ~56 (IEA '25; de Vries-Gao '25, midpoint of 33–80) · Bitcoin ~40 (Cambridge '25). All values ≈.
| Activity | Emission Estimate | Source (APA + link) | Data Location · Math Synopsis · Δ vs 2025 |
|---|---|---|---|
| Military (global / U.S.) | ~2,750 Mt CO₂e yr⁻¹ global (~5.5%); ~51 Mt yr⁻¹ U.S. DoD; 25 – 40 t soldier⁻¹ yr⁻¹ |
Parkinson, S., & Cottrell, L. (2022). Estimating the Military's Global Greenhouse Gas
Emissions. SGR / CEOBS.
Link Crawford, N. C. (2019). Pentagon Fuel Use, Climate Change, and the Costs of War. Costs of War Project, Brown Univ. Link |
Math. SGR/CEOBS: scaled per-capita military energy use + supply chains ⇒ ~5.5% of global
emissions
— more than civil aviation and shipping combined. If the world's militaries were a nation, they would
rank
fourth. DoD self-reports ~51 Mt CO₂e FY2021 (≈ Sweden). Per-soldier: ~25 t (direct operational) to ~51 t
(total ÷ active-duty count). Δ 2025: per-soldier figure unchanged; global total (2,750 Mt) added for scale. |
| Golf course (18-hole) | ~20.6 t CO₂e yr⁻¹ net per course; ~60 – 96 t gross before sequestration; ~0.7 kg per round played |
Staples, A. (2023). CarbonSave® Calculator (GCSAA 2015 land-use medians), via Driving the Green.
Link Tidåker, P., et al. (2017). "Energy use and greenhouse gas emissions from turf management of two Swedish golf courses." Urban Forestry & Urban Greening. Link |
Math. Industry calculator: typical course sequesters ~50 t yr⁻¹ in turf/soil yet still nets ~20.6
t. Peer-reviewed Swedish LCA: 1.0–1.6 t CO₂e ha⁻¹ yr⁻¹ gross × ~60 ha typical ⇒ 60–96 t gross. Per
golfer:
20,600 kg ÷ ~30,000 rounds yr⁻¹ ≈ 0.7 kg per round. Δ 2025: new row. The nuance: golf is carbon-modest (one course ≈ 4–5 cars) but water-extreme (one course irrigates ≈ 431 million L yr⁻¹ — see water chart). Carbon and water rankings of the same activity can invert. |
| Bitcoin network / ASIC miner | ~138 TWh yr⁻¹; ~39.8 Mt CO₂e yr⁻¹ network-wide; ~9 t CO₂e per continuously-run ASIC (heuristic) |
Cambridge Centre for Alternative Finance. (2025). Cambridge Digital Mining Industry Report / CBECI. Link · Summary |
Math. 2025 survey-based estimate: 138 TWh yr⁻¹ (~0.5% of global electricity, ≈ Poland), 39.8 Mt
CO₂e, 52.4% sustainable energy mix. Δ 2025: the May 2025 essay cited 91.4 Mt CO₂e from the prior CBNSI model; Cambridge's measured-mix revision cut this by more than half. Estimates change; this essay changes with them. |
| Gasoline car (12,000 mi yr⁻¹) |
~4.6 t CO₂e yr⁻¹ | United States Environmental Protection Agency. (2024). Greenhouse Gas Emissions from a Typical Passenger Vehicle. Link |
Math. EPA average 4.6 t yr⁻¹ for 11,500 mi. Δ 2025: unchanged; the baseline holds. |
| Transatlantic flight (RT, economy) | ~2.9 t CO₂e trip⁻¹ (RF × 2); 1.6 t CO₂e (CO₂-focused academic figure) |
atmosfair. (n.d.). Flight CO₂ Calculator & Climate Impact Methodology.
Calculator Wynes, S., & Nicholas, K. A. (2017). Environmental Research Letters, 12(7). Link |
Math. CO₂ only ≈ 1.45 t (LHR–JFK RT); atmosfair radiative-forcing factor 2 ⇒ 2.9 t. Wynes &
Nicholas's peer-reviewed per-roundtrip figure is 1.6 t. Both shown; chart uses 2.9 t for continuity with
the 2025 essay. Δ 2025: unchanged. |
| Chatbot text query (2025–26, measured) |
0.03 g CO₂e query⁻¹ (provider-measured median) to ~0.4 g (independent benchmark); 1 – 15 kg yr⁻¹ at 100 queries day⁻¹ |
Google. (2025, August). Measuring the environmental impact of AI inference.
Link Jegham, N., et al. (2025). How Hungry is AI? arXiv:2505.09598. Link You, J. (2025, February). How much energy does ChatGPT use? Epoch AI. Link |
Math. Provider boundary: 0.03 g × 100 × 365 ≈ 1.1 kg yr⁻¹. Independent boundary: ~1 Wh
query⁻¹ (GPT-4o measured range 0.42–1.79 Wh) × ~0.4 kg CO₂ kWh⁻¹ (US grid average) ≈ 0.4 g query⁻¹ ⇒
~15 kg yr⁻¹. Altman's unverified 0.34 Wh claim (The Gentle Singularity,
June 2025) falls mid-range but supplied no methodology. Δ 2025: was 2.2 g query⁻¹ / ≈40 kg yr⁻¹ (training-amortised heuristic). Measured data cut the central estimate ~10×; the old figure now sits at the very top of the plausible range. |
| Reasoning-model query (long chain-of-thought) |
~18 – 40 Wh query⁻¹; ≈ 7 – 16 g CO₂e query⁻¹ |
Jegham, N., et al. (2025). How Hungry is AI? Benchmarking Energy, Water, and Carbon Footprint of LLM Inference. arXiv:2505.09598. Link |
Math. Benchmarked: DeepSeek-R1 ≈ 29 Wh on long prompts vs. ≈ 2 Wh for DeepSeek-V3; reasoning
tiers
run 10–65× standard chat. 29 Wh × 0.4 kg kWh⁻¹ ≈ 11.6 g query⁻¹. Δ 2025: new row — inference-time scaling barely existed when the 2025 essay was drafted. The same question can now cost 100× more depending on how long the model "thinks." Medians hide this tail. |
| Agentic coding, extreme (≈80% of a Max-plan budget) |
~41 Wh per median agent session; ~1.3 kWh per heavy multi-agent workday; ≈ 100 – 300 kg CO₂e yr⁻¹ |
Couch, S. (2026, January 20). Electricity use of AI coding agents.
Link Anthropic. (2025–26). How do usage and length limits work? Claude Help Center. Link |
Math. Couch's measurement-based scaling: a median coding-agent session ≈ 41 Wh (≈138× a typical
chat query); a workday of parallel agents ≈ 1.3 kWh — "about one dishwasher run." Annualized: 1.3 kWh ×
250–365 days ≈ 325–475 kWh yr⁻¹ × 0.37–0.4 kg kWh⁻¹ ≈ 120–190 kg; sustained near a Max-20× weekly
ceiling (≈80% utilization — on the order of 1+ billion tokens/month, a documented heavy-user scale)
plausibly reaches ~300 kg yr⁻¹. Δ 2025: new row, and the most important one for honest self-accounting: an extreme agentic-coding year (~upper bound 300 kg) ≈ 6.5% of a car, ≈ 10% of a transatlantic round trip, ≈ 475 kWh ≈ 4.5% of average US household electricity (~10,500 kWh yr⁻¹). Tail caveat (spring 2026): Couch's 1.3 kWh/day measured human-in-the-loop heavy use; a true outlier running hours-long autonomous harnesses near a Max-20× ceiling plausibly draws 5–10 kWh/day ⇒ up to ~0.7–1.5 t CO₂e yr⁻¹ — still below one car, but above this row's top. No provider discloses agentic-workload footprints; this is the fastest-moving number in the essay. |
| Generative AI (1,000 images day⁻¹) | ≈ 40 – 430 kg CO₂e yr⁻¹ | Luccioni, A. S., Jernite, Y., & Strubell, E. (2024). Power Hungry Processing: Watts Driving the Cost of AI Deployment? Proc. FAccT '24. Link |
Math. Measured inference: 0.1 g image⁻¹ (tiny models) to ~1.2 g (SD-XL-class at 2.9 Wh image⁻¹ ×
0.4 kg kWh⁻¹). At 1,000 images day⁻¹ × 365: ≈ 40 – 430 kg yr⁻¹ (coal-heavy grids push toward ~600). Δ 2025: range top reduced from 1,100 kg: the old top extrapolated 3 g image⁻¹ for SD-3.5-Large via an N1.4 scaling guess; measured data replaced it. The 2025 claim survives, strengthened: a year of 1,000 images every day still emits less than feeding a large dog, and far less than one transatlantic round trip. (Video generation is orders of magnitude costlier per output and remains undisclosed by providers.) |
| Video streaming | ~36 – 55 g CO₂e h⁻¹; 26 – 40 kg yr⁻¹ (2 h day⁻¹) |
Kamiya, G. / IEA. (2020). The carbon footprint of streaming video: fact-checking the headlines.
Link Carbon Trust. (2021). Carbon Impact of Video Streaming. Link |
Math. IEA central estimate 36 g h⁻¹; Carbon Trust European average 55 g h⁻¹. × 2 h day⁻¹ × 365 =
26
– 40 kg yr⁻¹. Δ 2025: the 2025 essay used the 55 g figure only; the IEA's lower fact-checked central estimate widens the range downward. For calibration: a 50-query chatbot day costs about the same as 2–20 minutes of streaming. |
| Beef consumption (typical US) | ~60 kg CO₂e per kg beef; ~1.56 t yr⁻¹ at 26 kg yr⁻¹ |
Poore, J., & Nemecek, T. (2018). Science, 360(6392), 987–992. Link · OWID summary |
Math. Global-average beef-herd intensity ≈ 60 kg CO₂e kg⁻¹ × ~26 kg per-capita US consumption ≈
1.56 t yr⁻¹. One beef habit ≈ 200–3,000 years of measured chatbot use. Δ 2025: new row (the 2025 essay treated diet as meat-rich vs. vegan totals: 2,620 vs. 1,055 kg — both still valid; this row isolates the beef component). |
All these are estimates.
Little is quantitatively exact in such sprawling planetary systems.
Provider per-prompt figures exclude embodied emissions — chip fabrication, data-centre concrete and steel, the cradle-to-grave pathways — which remain the largest disclosure gap (Mistral's audited LCA suggests hardware adds a meaningful but not dominant share). Little is quantitatively exact in such sprawling planetary systems. But pause to consider: the claim that anchored the 2025 essay — an AI user generating 1,000 images per day for an entire year cumulatively generates less than the climate impact of feeding a large pet dog, or one passenger seat on a transatlantic flight — has now been confirmed and strengthened by measured disclosure data.
If the data is correct, then
one programmer running AI coding agents all day, every day, for a year
emits less carbon than 1/10th of one passenger
on one transatlantic round trip flight.
[Sources: coding-agent energy,
measured (Couch '26) ·
round trip ≈2,900 kg CO₂e
incl. RF×2 (atmosfair) ·
math: extreme coding year ≈100–300 kg vs 290 kg = 1/10 flight — full workings in the table above]
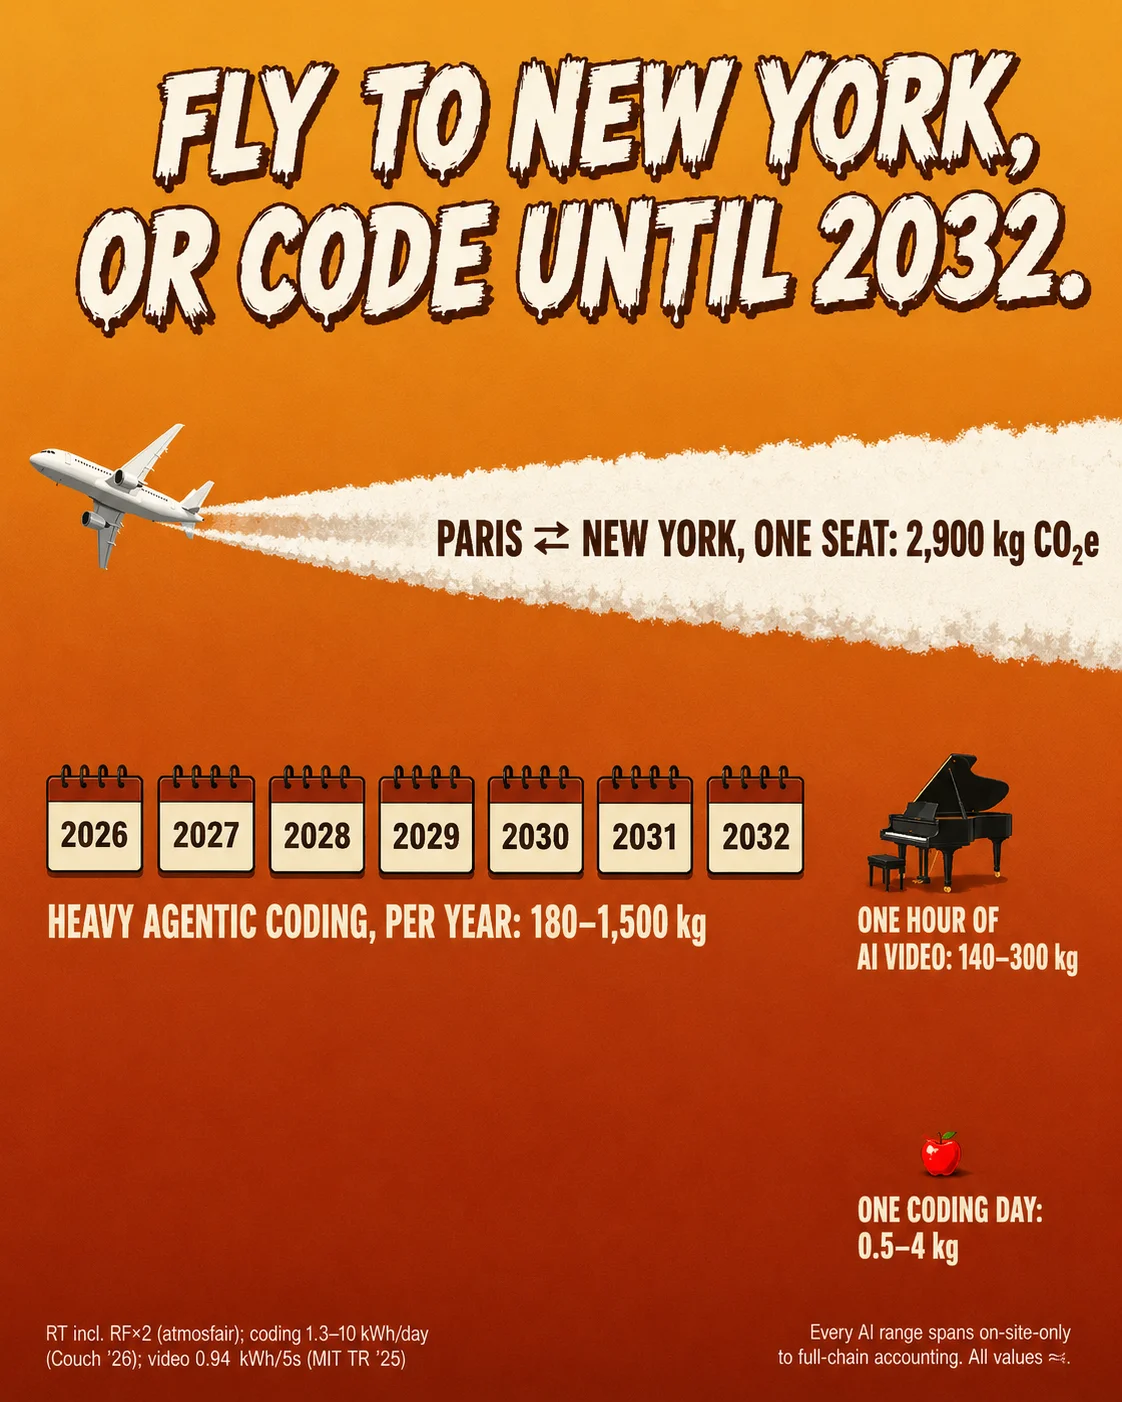
PSA №2 — "Fly to New York, or Code Until 2032." One Paris⇄New York round trip, economy, one passenger ≈ 2,900 kg CO₂e including non-CO₂ radiative forcing (atmosfair; CO₂-only ≈ 1,450 kg; the peer-reviewed per-roundtrip figure is 1.6 t, Wynes & Nicholas 2017). Heavy agentic coding ≈ 0.5–4 kg/day, 15–120 kg/month, 180–1,500 kg/year (measured human-in-the-loop → autonomous-harness outlier; Couch 2026). One hour of AI-generated video ≈ 140–300 kg (MIT Technology Review 2025 energy basis). One flight ≈ 2–16 years of heavy coding ≈ 10–21 hours of generated video. Every AI range spans on-site-only to full-chain accounting.
In 2025, water became the sharpest front of the AI-environment debate,
argued largely from a
single (excellent) paper: Making AI
Less "Thirsty".
But in
2026 there is more data.
2025 peer-reviewed data from Li, Yang, Islam & Ren's Making AI Less "Thirsty" (arXiv 2023; ACM, 2025) showed:
2026: Google research measured median water use — 0.26 mL per prompt — three orders of magnitude below the 2025 "bottle of water per conversation" meme. Ren has publicly criticized Google's figure for omitting exactly the indirect, electricity-embedded share. Independent benchmarking now sits between them: a short GPT-4o query ≈ 1.2 mL including off-site water; the most efficient small models < 2 mL even on long prompts; DeepSeek-R1-class reasoning on long prompts > 200 mL (Jegham et al., 2025).
The data-dense independent treatment is SemiAnalysis's From Tokens to Burgers — A Water Footprint Face-Off (2026): a bottom-up model of xAI's 400 MW Colossus 2 facility in Memphis — ~267 million gallons evaporated annually for cooling, ~66 million withdrawn-but-returned for adiabatic flushing, ~13 million gallons/year of amortized chip-manufacturing water; ~346 million gallons/year total; water-use effectiveness 0.51 L/kWh. Their comparisons are deliberately vertiginous: one hamburger (245 gallons ≈ 927 L embedded, ~95% in beef) equals the water footprint of using Grok thirty times a day for 668 years; the entire Colossus 2 campus consumes only ~2.4× the water of the burgers sold by a single In-N-Out restaurant. (Not unrebutted: an engineering critique argues the burger framing risks letting policymakers understate datacenter water and that the 2.4× ratio shouldn't be extrapolated to every future campus, and an academic analysis finds that inconsistent accounting scopes render burger- and golf-style comparisons uninformative for public-water planning. SemiAnalysis, for its part, counted only "blue" water on both sides — the burger figure already excludes rainfall.)
The water used chatting with AI 50× a day, every day, for a year
≈
the water
embedded in eating one beef burger.
[50 × 365 × 45 mL full-chain (Mistral LCA) ≈
821 L vs one burger ≈ 927 L (SemiAnalysis) — true
even at the highest AI accounting]
Annual habits and single events together — mixing durations is the point: it shows how many years of digital habit fit inside one lunch. Each full bar = 100,000 L; big values stack bars. AI = dark blue, spanning on-site-only → full-chain accounting.
Beef: 26 kg/yr × 15,400 L/kg (Mekonnen & Hoekstra '12). Coffee: ~140 L/cup embedded, mostly rain-fed "green" water (WFN). Shower: EPA WaterSense 2.1 gal/min × 8 min × 365. AI rows span on-site WUE (0.5 L/kWh, SemiAnalysis '26) to full-chain incl. electricity-embedded water (5 L/kWh, Macknick '12 / Ren '25): images 2.9 Wh each (Luccioni FAccT '24); reasoning 4–200 mL/query (Jegham '25); video 678 kWh/hr (MIT TR '25); coding 130–1,000 Wh/hr (Couch '26); chatbot 0.26 mL (Google '25, on-site median) → 45 mL (Mistral ADEME full-LCA). Burger 245 gal (SemiAnalysis '26) → 2,350 L (WFN all-colors); tofu ~160 L (WFN); bathtub/flush EPA. Screen-hours barely register: gaming ≈0.2–2 L/hr, streaming ≈0.2–0.4 L/hr, web ≈0.1–0.3 L/hr. One 18-hole golf course irrigates ≈431,000,000 L/yr — 4,310 of these bars (USGA). Green-vs-blue caveat: coffee's rainfall and a datacenter's evaporated potable water in a stressed basin are not ecologically identical — comparisons orient, they don't absolve. All values ≈.
Reading. The AI bars, drawn at the top of their ranges, barely register against food and turf: the most damning AI year (~3,700 L) equals four burgers or two months of showers. The genuine water issue is siting — see below.
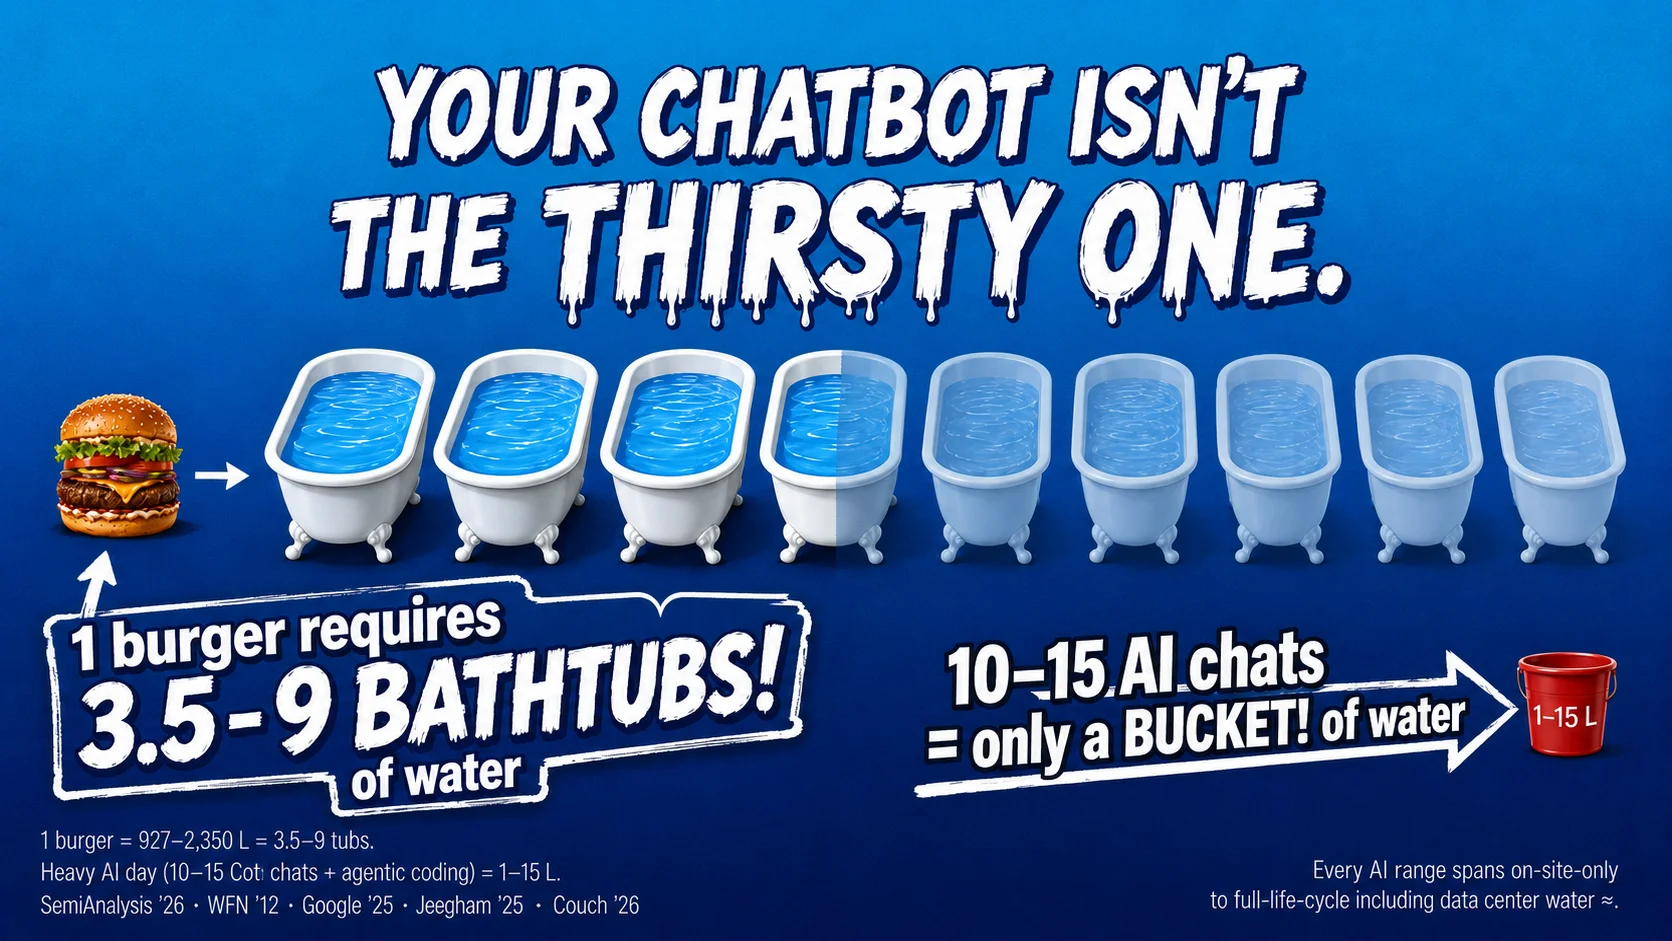
PSA №1 — "Your Chatbot Isn't the Thirsty One." One beef burger embeds 927–2,350 L of water — 3.5–9 full bathtubs (≈265 L each, EPA) — depending on whether US blue-water (SemiAnalysis 2026) or global all-colors accounting (Mekonnen & Hoekstra 2012) is applied. The bucket: one day of heavy AI use — 10–15 chain-of-thought conversations (Jegham et al. 2025; Google 2025) plus a full day of agentic coding (Couch 2026; Macknick et al. 2012) — totals ≈ 1–15 L. Every AI range spans on-site-only to full-chain accounting. Image: generated from the campaign-brief prompt (GPT-Image, June 2026).
500 AI-IMAGES per day, EVERY DAY for a YEAR
uses approx. same amount of water
as ONE BEEF
BURGER
US golf courses irrigate roughly thirty times more water annually than every data centre in the country directly consumes (USGA; LBNL). US agricultural irrigation withdrawals (~118 billion gallons/day) would extend ~78 chart-widths. Caveats cut both ways: golf increasingly uses recycled non-potable water, and "withdrawal" ≠ "consumption" — see the boundary disclaimer above.
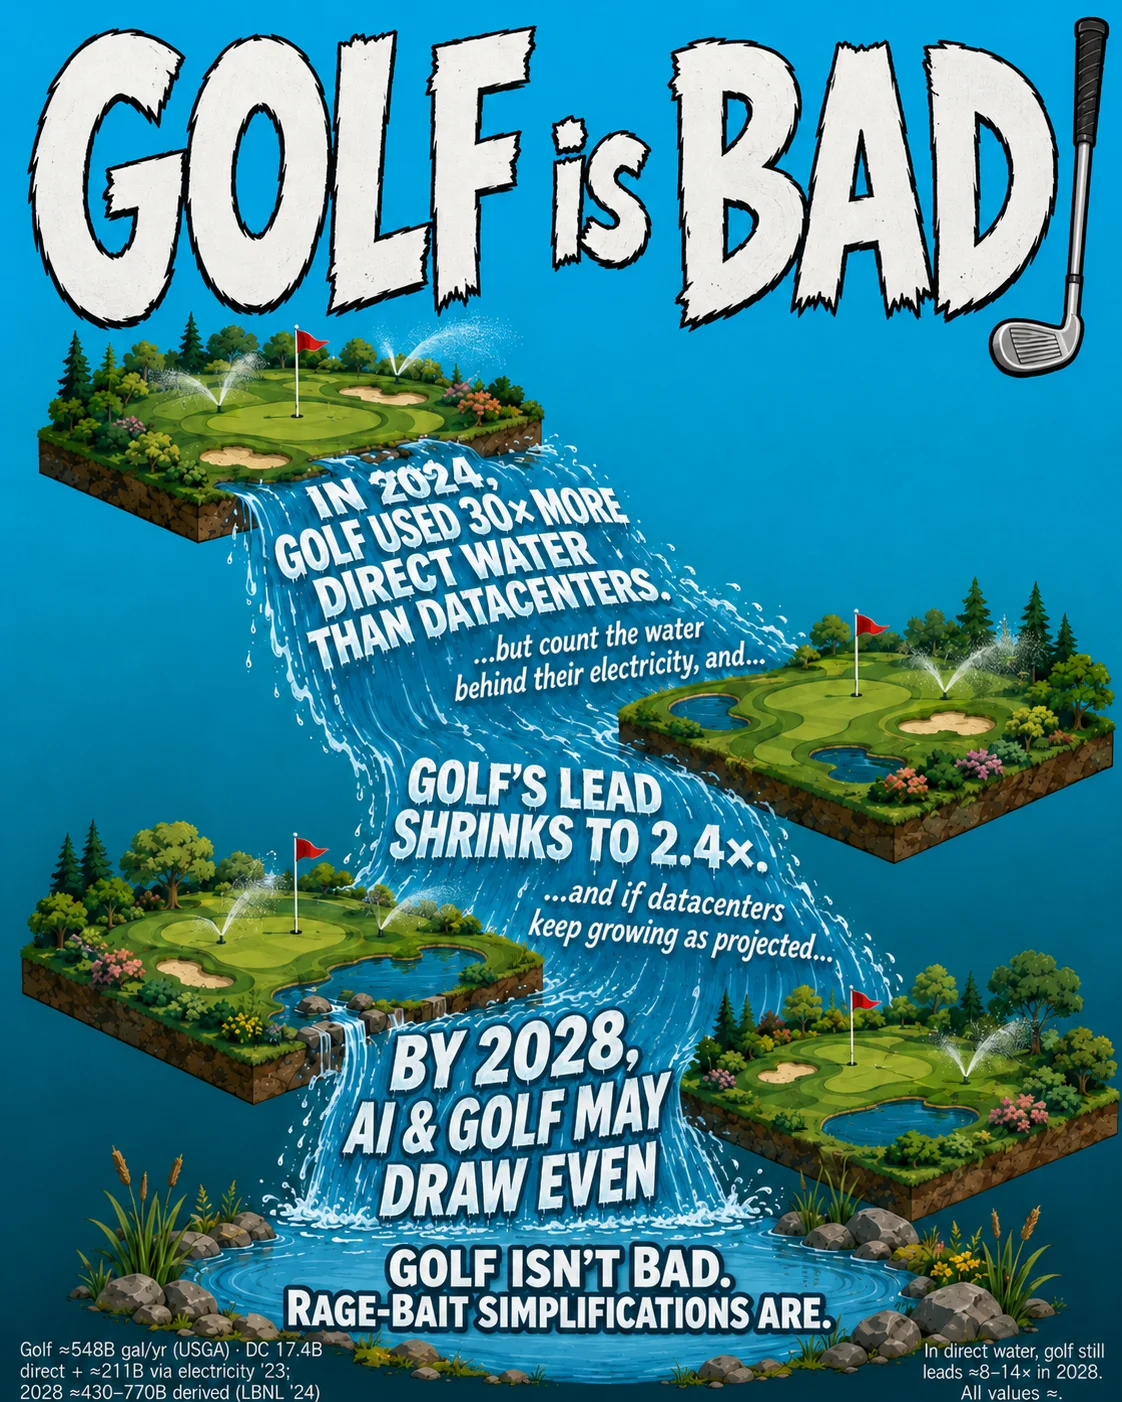
PSA №6 — "GOLF is BAD!" (it isn't; single-number headlines are). The cascade, every number sourced: US golf irrigation ≈548 billion gal/yr (USGA) vs. US data centres' direct consumption 17.4 billion gal (2023) — 31:1. Add the ~211 billion gal evaporated at the power plants making their electricity (≈10× the on-site total) and golf's lead shrinks to ≈2.4:1 — coincidentally the same ratio as Colossus-to-In-N-Out above: 548/228 ≈ 346/147 ≈ 2.4, different numbers, same rounding (LBNL 2024). Scale that with LBNL's 2028 electricity projection (325–580 TWh) and the full-chain total (≈430–770 billion gal) reaches rough parity with golf — though in direct water, golf still leads ~8–14× in 2028 (38–73 billion gal projected direct). Caveats both ways: golf's figure is survey-vintage and increasingly recycled non-potable water; the 2028 indirect figure naively scales today's grid-water intensity, which falls as wind and solar grow. Same activity, three boundaries, three headlines — see Figure 0.
And yet…
data centres' air-pollution health burden is modelled to exceed $20 billion/yr by
2028.
The same year produced Bloomberg's finding that roughly two-thirds of new US data centres built or planned since 2022 sit in regions of high water stress — 26 in Arizona, 26 in Texas, 67 in Virginia — with similar or worse siting patterns in China, India, and the Gulf (Bloomberg, 2025). The Dalles, Goodyear, Querétaro, and Memphis are real places with real aquifers. And the fence line compounds the inequity: in South Memphis, xAI's data centre runs dozens of methane gas turbines beside Boxtown, a historically Black neighbourhood already carrying a cancer risk four times the national average — now the subject of NAACP / Southern Environmental Law Center legal action (SELC 2025; Earthjustice 2026). Peer-reviewed modelling estimates US data centres' air-pollution public-health burden will exceed $20 billion/yr by 2028, with per-household costs in the most-affected, disproportionately disadvantaged counties up to 200× those elsewhere (Han, Ren et al. 2024). These burdens are decided per facility — by turbines, permits, and zoning — which is precisely why this essay's asks are disclosure and siting standards rather than user guilt. The correct synthesis is neither "AI barely uses water" (true globally, sometimes false locally) nor "AI is drinking the planet" (false at every scale). It is: water impact is a siting and disclosure problem, not a per-prompt problem. A prompt is a drop; a gigawatt campus in a desert is a policy choice.
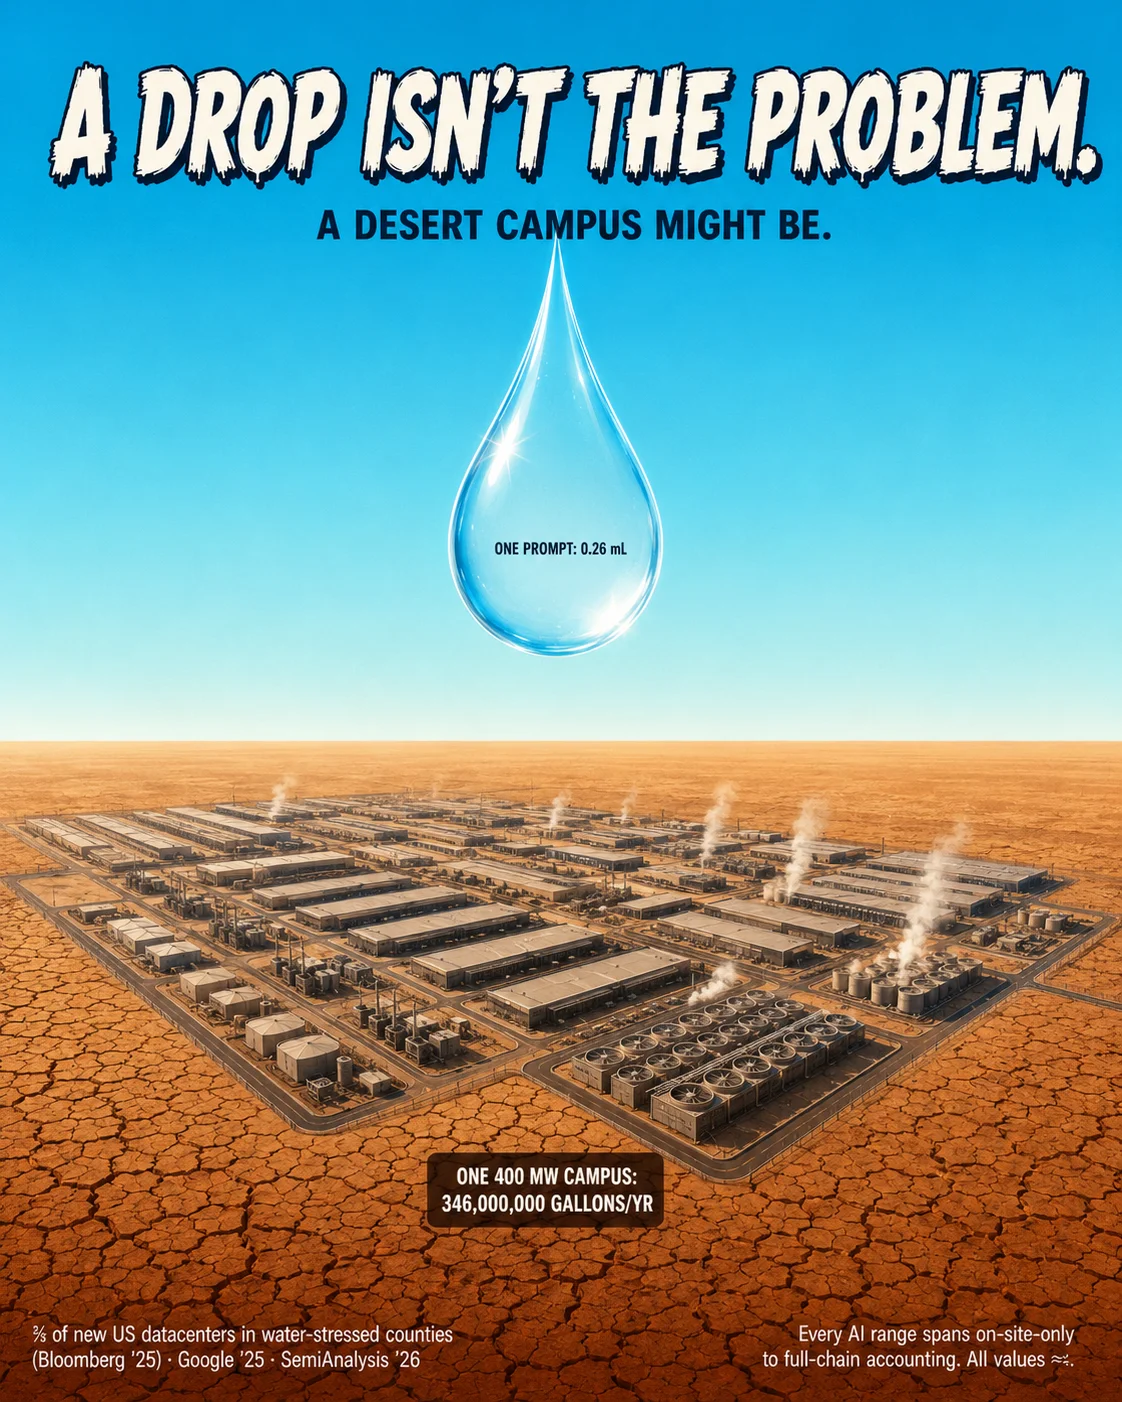
PSA №3a — "A Drop Isn't the Problem. A Desert Campus Might Be." A median prompt evaporates 0.26 mL on-site (Google 2025) — but roughly two-thirds of new US data centres built or planned since 2022 sit in regions of high water stress (Bloomberg 2025), and a 400 MW campus consumes ~346 million gallons/yr (SemiAnalysis 2026). The water question is where, not whether.
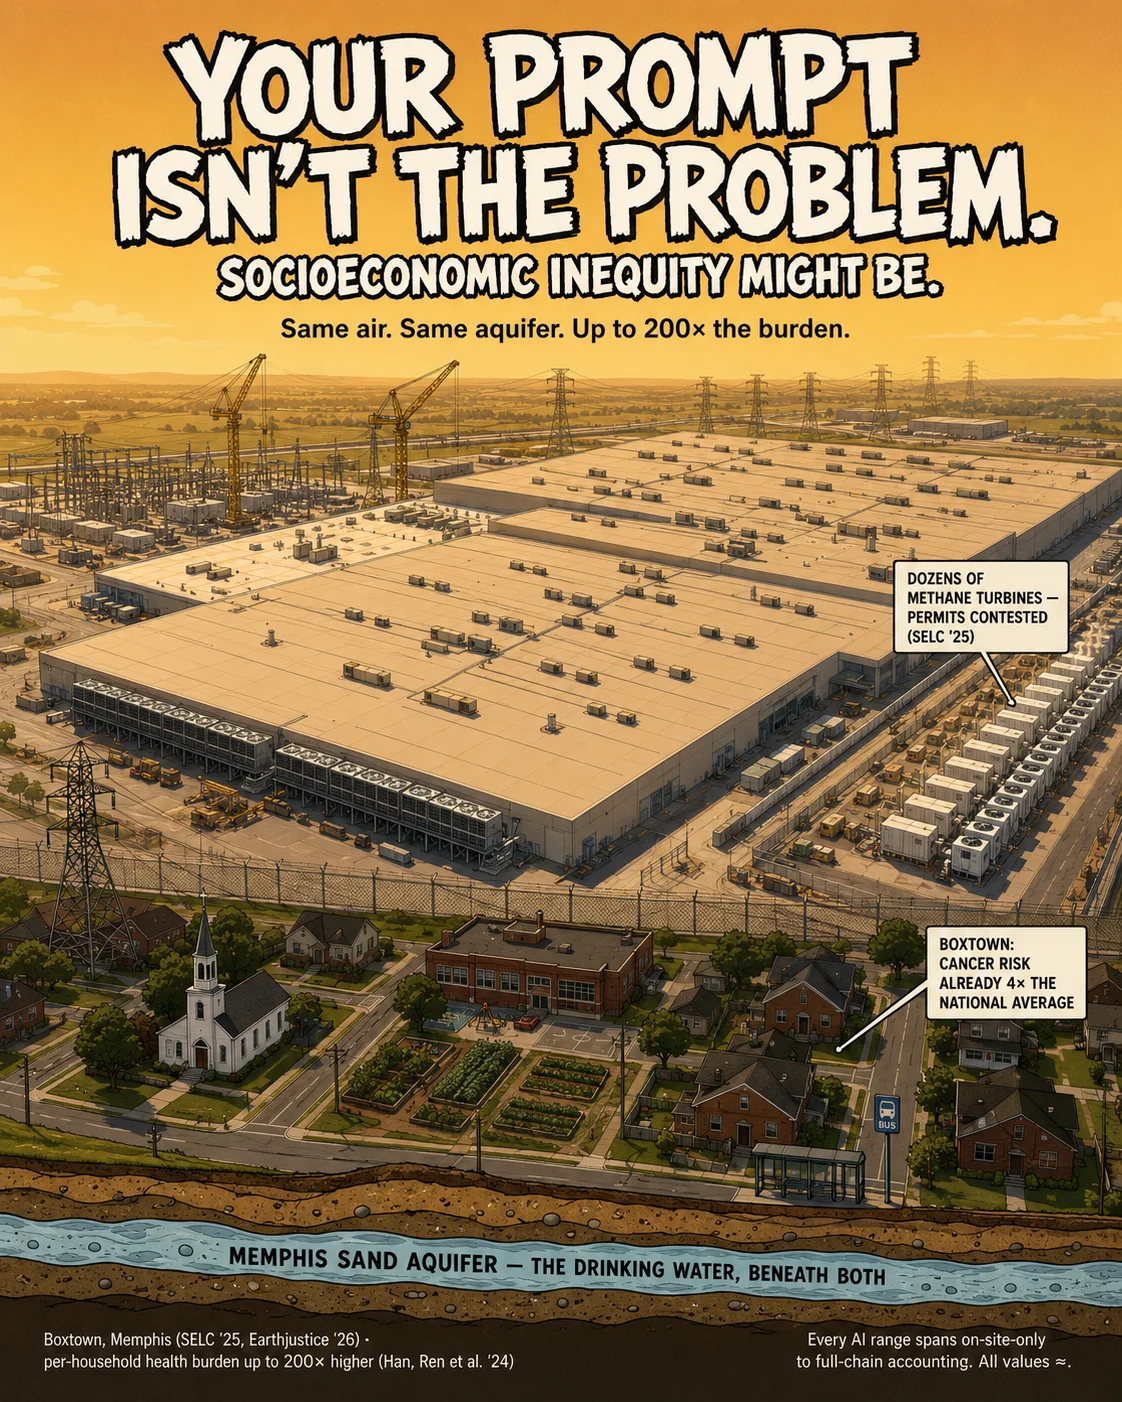
PSA №3b — "Your Prompt Isn't the Problem. Socioeconomic Inequity Might Be." Same air, same aquifer, not the same burden: xAI's Memphis data centre runs dozens of methane gas turbines beside Boxtown, a historically Black community already carrying a cancer risk four times the national average — now the subject of NAACP / Southern Environmental Law Center legal action (SELC 2025; Earthjustice 2026). Peer-reviewed modelling puts US data centres' public-health burden above $20 billion/yr by 2028, with per-household costs in the most-affected, disproportionately disadvantaged counties up to 200× those elsewhere (Han, Ren et al., "The Unpaid Toll"). The service is global; the burden is local. Turbines, permits, and fence lines are decided per facility — which is exactly why disclosure and siting standards, not user guilt, are this essay's asks.
What does the data say now?
"Data centre electricity consumption is estimated to amount to around 415 terawatt hours (TWh), or about 1.5% of global electricity consumption in 2024 … projected to double to reach around 945 TWh by 2030 in the Base Case, representing just under 3% of total global electricity consumption" — IEA, Energy and AI (World Energy Outlook Special Report), April 2025. The 2022 figure cited in the May 2025 essay was 240–340 TWh; the curve is real.
"Electricity demand from data centres surged by 17% in 2025 … AI-focused data centres climbed even faster — well outpacing growth in global electricity demand of 3%." Satellite tracking shows "AI factory" capacity more than tripling in eighteen months. Hyperscaler capital expenditure exceeded USD 400 billion in 2025 and is expected to rise ~75% in 2026; gas-turbine orders stand at a 25-year high, with 15–27 GW of on-site gas projected for US data centres by 2030 and ~20% of planned projects at risk of grid-connection delays. — IEA news & IEA, Key Questions on Energy and AI.
US data centres consumed 176 TWh (4.4% of US electricity) in 2023, up from 58 TWh in 2014; projected 325–580 TWh (6.7–12%) by 2028. — Lawrence Berkeley National Laboratory, December 2024 (the Congressionally-mandated US assessment).
The first peer-reviewed isolation of AI's specific share: "The carbon footprint of AI systems alone could be between 32.6 and 79.7 million tons of CO₂ emissions in 2025, while the water footprint could reach 312.5–764.6 billion liters." — de Vries-Gao, Patterns, December 2025. A small European country's footprint, growing fast from a small base: roughly Bitcoin-to-Austria-sized, ~1–2% of what global militaries emit.
Our World in Data reports: aviation ≈ 2.5% of global CO₂ (882 Mt in 2024), ~4% of warming once non-CO₂ effects (contrails, ozone, soot, water vapor) are counted. Data-centre electricity-related emissions were ≈ 182 Mt CO₂ in 2024 — about a fifth of aviation — projected to ~1% of global CO₂ by 2030 in the IEA's central case (~1.4% fast-growth), ~350 Mt by 2035 (Carbon Brief synthesis).
Note: "Aviation" slice shown for climate context although its energy is liquid fuel, not
electricity.
"AI-accelerated servers" are not necessarily dedicated exclusively to AI. "All other sectors" = industry,
buildings, non-AI ICT, transport, public services, agriculture, etc. Compared with the May 2025 pie, AI's slice
grew from ~0.4% toward ~0.6% — the only slice that moved.
Sources: IEA Energy & AI, Apr 2025; IEA Key Questions on Energy and AI (2025 actuals);
Cambridge CBECI (138 TWh ≈ 0.5%); Brown University Costs of War + SGR/CEOBS (military); Our World in Data
aviation dataset (2.5% CO₂, ~4% warming).
The 2025 essay predicted AI "will grow exponentially."
True, it grew — in capacity, capex,
and consumption.
Remember: In 1999, Forbes published "Dig More Coal — the PCs Are Coming," claiming the internet already used 13% of US electricity and would soon use half. The real figure was ~1–2%, and Jonathan Koomey spent a decade correcting it (Koomey). Between 2010 and 2018, global data-centre compute grew ~550% while electricity use grew ~6% — efficiency absorbed nearly all demand growth (Masanet et al., Science, 2020). Keep that in mind.
That said, this cycle differs from 2000 in three measurable ways. First, the demand is metered, not hypothetical: 2025's ~17% growth happened on utility meters. Second, the capital is committed: >$400B of 2025 hyperscaler capex, rising ~75% in 2026. Third, the bottlenecks are physical and visible: multi-year gas-turbine lead times, doubled transformer wait times, interconnection queues (IEA).
Even the high-end predictions anticipate AI under ~2% of global carbon emissions by 2030.
Even the high ends keep AI under ~2% of global emissions by 2030 — a fraction of today's military (~5.5%), in aviation's neighbourhood (~2.5%) only in the most aggressive scenarios. But two asymmetries temper comfort. Direction: aviation and crypto are roughly flat; AI is the fastest-growing industrial electricity load on Earth, and is extending the lives of gas and coal plants in specific grids now, whatever the 2030 averages say. Jevons: Google's per-prompt energy fell 33× in a year while its absolute emissions rose 51% above its 2019 baseline (11.5 Mt CO₂e in 2024); Microsoft's are up 23.4% since 2020, attributed by the company to AI data-centre construction. When Satya Nadella invoked Jevons' paradox in January 2025, he was making a business forecast: efficiency lowers the price of intelligence, which multiplies consumption — exactly as Jevons described coal in 1865. Efficiency alone has never capped a useful technology's total consumption; only saturation, price, or policy has.
What would change this analysis. Falsifiability, stated plainly — the observations that would force this essay's conclusions to move:
(1) AI video generation reaching streaming-scale adoption at anything near today's ~680 kWh/generated-hour — per-user footprints would jump 100–1,000× and the "triviality" framing collapses. (2) A credible disclosure showing reasoning/agentic medians near the current benchmark tails (≥10 Wh/query) — the median-vs-tail distinction would dissolve. (3) 2027 metered demand exceeding the IEA Lift-Off case — the extrapolation cone's upper edge becomes the central line. (4) Evidence of systematic WUE/water under-reporting — the aggregate water comfort would need re-derivation from independent measurements.
(1) A 2010–2018-style flattening: efficiency and saturation absorbing demand growth as Masanet et al. documented last cycle. (2) Verified additional clean generation matching new load (24/7 CFE with hourly accounting) at the major operators — decoupling absolute emissions from buildout. (3) Audited evidence of AI-enabled emissions reductions (grid optimization, materials discovery) exceeding data-centre emissions — the IEA's "potential" becoming measured fact.
AI growth in energy demand is best understood as a cone of uncertainty: AI ends the decade somewhere between "another aviation" (a real, bounded, ~1–2% wedge demanding genuine decarbonization) and "another false coal alarm" (efficiency and saturation flattening the curve, as in 2010–2018). The IEA's counter-ledger belongs in the cone too: AI-enabled optimization of grids, buildings, transport, and materials discovery could plausibly avoid more emissions than data centres emit — a potential, not a promise, and one no company should be permitted to claim as an offset without showing the arithmetic.
AI remains, as of 2026, a small slice of the catastrophe — and it is the slice that is growing. Consider also what it contributes: knowledge, medicine, proteins, materials discovery, optimization, code, companionship in thought. It is a profoundly useful technology. Usefulness is precisely why its curve, alone among the slices, points up.
To the accelerationist who waves the AI-carbon-impact question away: the buildout you celebrate added more absolute emissions at Google and Microsoft in five years than per-prompt efficiency can hide, is two-thirds sited in water-stressed counties, is extending fossil plants in specific grids, and is governed by for-profit privacy-cloaked tech-bro companies.
Each category represents a distinct metabolic process within our planetary system, characterized by specific patterns of molecular exchange. The cards below update the 2025 analysis where the data moved.
0.24 Wh · 0.03 g CO₂e · 0.26 mL water per median prompt (provider-measured)
Median Gemini Apps text prompt, August 2025 disclosure; independent benchmarks 0.4–1.8 Wh for GPT-4o-class queries
The decisive event of the year: a hyperscaler published a full measurement methodology — active accelerators, host CPU and DRAM, idle reserve machines, and data-centre overhead (PUE) all included — and reported a median prompt 33× more energy-efficient and 44× lower-carbon than twelve months prior — gains traceable to TPU generational efficiency (Google, arXiv 2606.15870). Independent benchmarking (Jegham et al.) lands within roughly 2–7× of the provider figure depending on prompt length, which for this literature constitutes remarkable convergence.
Note: median, not mean; market-based emissions accounting; on-site water only; excludes voice, image, video, and the reasoning tail. Shaolei Ren and others have published substantive critiques of these boundaries. The figure is a floor with an audit trail, not a ceiling.
Google (2025). "Measuring the environmental impact of AI inference." & MIT Technology Review coverage & Jegham et al. (2025), arXiv:2505.09598
~18 – 40 Wh per long reasoning query; 10 – 65× standard chat; >200 mL water per long R1-class query
Chain-of-thought models (o3 / DeepSeek-R1 class) on long prompts
Inference-time scaling — the technique behind 2025–26's reasoning gains — spends compute at answer time. The same question can cost 100× more depending on how long the model deliberates, and the water follows the watts: the most efficient models stay under 2–4 mL per query while R1-class deployments exceed 200 mL on long prompts. Median-prompt disclosures do not cover this tail; no provider has yet published reasoning-mode or video-generation footprints.
Note: this is the genuinely new uncertainty since the 2025 essay, and the strongest argument against complacency about per-query trivia: the tail is fat, growing, and undisclosed.
≈ 41 Wh per median agent session · ≈ 1.3 kWh per heavy multi-agent workday · ≈ 100–300 kg CO₂e and 240–2,400 L water per extreme year
Daily parallel coding agents at ~80% of a Claude-Max-class plan budget (order of 1+ billion tokens/month)
The first careful measurement-based estimate of agentic coding (Couch, January 2026) scales token-level energy figures to real Claude Code sessions: a median session ≈ 41 Wh — about 138 typical chat queries — and a workday of parallel agents ≈ 1.3 kWh, "about one dishwasher run" or a refrigerator-day. Annualized at extreme intensity this is ~325–475 kWh: real enough to deserve a row on the chart, small enough that a full year of it emits less than one-tenth of a single transatlantic round trip and ~5% of average US household electricity.
Note: agentic workloads multiply queries invisibly — the user types one sentence; the agent issues hundreds of calls. This is where individual AI footprints will actually grow, and where per-"query" accounting quietly becomes obsolete. Water range spans on-site WUE (0.5 L/kWh) to full-chain (~4–5 L/kWh) boundaries.
Couch (2026). "Electricity use of AI coding agents." & Anthropic Help Center: usage limits
0.13 – 45 mL per response (boundary-dependent); US data centres 17.4 B gal direct / 211 B gal indirect (2023)
Per-response figures span on-site-only to full-lifecycle accounting; aggregate figures from the Congressionally-mandated LBNL assessment
Globally and nationally, AI's water draw is small: all US data centres directly consume ~3% of what US golf courses irrigate; a year of standard chatbot use (5–820 L, boundary-dependent) embeds less water than a single hamburger (927 L); even an extreme reasoning-heavy year (~3,700 L) equals four burgers or two months of showers. Locally, the picture inverts: two-thirds of new US data centres since 2022 sit in high water-stress regions, and a gigawatt campus negotiates with a specific aquifer, not a national average. Closed-loop and dry-cooling designs (rising WUE transparency, hybrid dry/adiabatic systems at Colossus 2) are the engineering response; siting policy is the political one.
Note: always ask of any water figure — withdrawal or consumption? on-site or electricity-embedded? potable, reclaimed, or rain-fed "green" water? The 350× spread in per-prompt estimates is boundary arithmetic, not controversy about physics.
Li, Yang, Islam & Ren (2025), CACM & SemiAnalysis (2026) & Bloomberg (2025) & IEEE Spectrum
≈ 20.6 t CO₂e net per course per year · ≈ 431 million L irrigation per course per year
One typical 18-hole US facility; ~16,000 US courses ⇒ ~548 billion gallons/yr nationally
Golf earns its place in this analysis precisely because its two footprints invert: in carbon terms a course is modest (net ~20.6 t/yr after turf-soil sequestration — roughly four cars; ~0.7 kg per round played), but in water terms a single course irrigates more in a year than three hundred thousand years of heavy chatbot use, and the national fleet of courses out-consumes the entire US data-centre industry's direct draw thirty-fold. Any framework that ranks activities on one molecule only will misjudge activities like this — and like AI, whose carbon-vs-water profile also depends entirely on which boundary is queried.
Note: golf carbon data is industry-calculator grade (flagged accordingly); the Swedish peer-reviewed LCA (1.0–1.6 t CO₂e/ha/yr gross) brackets it. Golf water data (USGA/GCSAA surveys) is robust. Many courses increasingly irrigate with recycled non-potable water — the same siting-and-sourcing nuance that applies to data centres.
Driving the Green / CarbonSave (GCSAA data) & Tidåker et al. (2017) & USGA water survey
≈ 138 TWh and 39.8 Mt CO₂e network-wide (2025)
Cambridge survey-based estimate; 52.4% sustainable energy mix reported by miners
The 2025 essay cited 91.4 Mt CO₂e from Cambridge's prior model. The 2025 Digital Mining Industry Report, built on measured miner energy mixes rather than worst-case grid assumptions, cut the estimate by more than half. Proof-of-work's social-utility question stands unchanged; its emissions estimate, honestly, fell. Bitcoin and AI now emit within the same order of magnitude (≈ 40 vs. ≈ 33–80 Mt) — with the difference that Bitcoin's curve is flat and AI's is not, and AI returns medicine, materials, and knowledge against its joules.
Note: revising a number downward when the evidence improves is the price of citing numbers at all. This card is the receipt.
415 TWh (2024) → ~945 TWh (2030); 182 Mt CO₂ (2024) → ~1% of global CO₂ (2030)
Global data-centre trajectory, IEA base case; 2025 actual growth +17%
Whatever the per-prompt charts show, the industry is pouring concrete, restarting nuclear plants (Three Mile Island/Crane for Microsoft; Kairos for Google; X-energy for Amazon), and ordering gas turbines at a 25-year high — 15–27 GW of on-site gas projected for US data centres by 2030. Google's absolute emissions are +51% over 2019 even as its data-centre energy emissions fell 12% on 27% more electricity (genuine decoupling, overwhelmed by growth); Microsoft's are +23.4% over 2020. And the disclosure floor is rising: on 10 June 2026 Amazon — historically the largest blind spot — published its first absolute figure, 2.5 billion gallons (9.46 billion L) of data-centre water withdrawn in 2025 at a best-in-class 0.12 L/kWh WUE, ~⅔ returned. Watch what they build, not what they tweet.
Note: corporate "net-zero by 2030" pledges now coexist with rising absolute emissions at every hyperscaler. Additionality — new clean generation matched to new load, not certificates shuffled across a continent — is the test that matters.
IEA (2025), Energy and AI & Google Environmental Report 2025 & Microsoft 2025 Sustainability Report & AWS Water Disclosure 2026 (DCD)
≈ 2,750 Mt CO₂e annually (~5.5% of global); ≈ 25,000 – 50,000 kg CO₂e per US soldier
Global military carbon footprint, SGR/CEOBS estimate; US DoD self-reports ~51 Mt CO₂e
Nothing in the AI debate altered this category, which is the point of keeping it here. The global military footprint — exempt from mandatory UNFCCC reporting since Kyoto — exceeds all data centres on Earth by roughly fifteen-fold, and exceeds AI specifically by roughly fifty-fold. If the world's militaries were a country, they would have the fourth-largest national footprint. Transmuting human aggression and acquisitiveness remains key to resolving climate change.
Note: estimate, not census — militaries do not report. True full-spectrum impact (Scopes 1–3, plus post-conflict reconstruction) would likely exceed the figure shown.
SGR & CEOBS (2022) & Crawford (2019), Costs of War, Brown University
~
The per-user comparisons above are mathematically accurate for one person's daily habits — but reading AI's footprint through "carbon" or "water" alone hides three systemic effects. The June 2026 United Nations University report Environmental Cost of Artificial Intelligence (UNU-INWEH) names them; each chevron opens the evidence.
Operational metrics (watt-hours, litres) ignore the hardware lifecycle. AI accelerators turn over every 24–36 months, and the UNU report projects up to 2.5 million tonnes of AI e-waste per year by 2030 — consistent with the 1.2–5.0 Mt peer-reviewed range (Wang et al., Nature Computational Science). The decoupling is geographic: the model's value is consumed in the Global North while e-waste processing and rare-earth extraction concentrate in the Global South — the same burden-shifting visible at the fence line in Memphis, scaled to the planet.
Carbon and water do not fall in tandem. When an operator cuts its carbon footprint by shifting load to zero-carbon baseload — nuclear, or concentrated solar-thermal — the water footprint often rises, because those generation cycles are heavily evaporative. A prompt routed to a "perfectly green" grid can simultaneously deepen a local watershed deficit. The UNU report frames this as the core tension of single-metric optimization; it is also why §water above insists the real issue is siting, not the prompt.
Every equivalence here assumes today's baselines. "A year of chatting ≈ one burger" rests on the current resource intensity of industrial agriculture; if food systems decarbonize and de-water over the next decade, the comparative "cheapness" of digital consumption shifts with them. The comparator is a tool for contemporary spatial context — orienting one person's choices today — not an endorsement of the buildout's long-run sustainability. The aggregate curve, not the per-prompt ratio, is what the next decade turns on.
To the friend who questions your daily AI use:
a year of your prompting costs the
atmosphere
less than one tank of gasoline,
and the watershed less than one hamburger.
Refusing a tool of genuine cognitive value on per-use environmental grounds — while supporting military growth, driving a car, flying for pleasure, having kids, playing golf, and/or eating a carnivore diet — is not environmentalism; it is virtue signalling.
To the accelerationist who waves the question away: the buildout you celebrate added more absolute emissions at Google and Microsoft in five years than per-prompt efficiency can hide, is two-thirds sited in water-stressed counties, is extending fossil plants in specific grids, and is governed by companies of which only two have published audited footprints — OpenAI and Anthropic disclose essentially nothing standalone. "Trivial per-use and consequential in aggregate" is also how automobiles looked in 1926.
The defensible demands are structural, not personal:
Carbon molecules recognize no territorial demarcations;
their movements constitute a planetary
metabolism.
The molecular-exchange meditation continues in the 2025 Carbon-Cost of AI essay
·
Parallel
interventions: Everyone at Home Everywhere · Whole-Use-AI
±
±
Alexander, Alistair / Reclaimed Systems. 2026. "Every Sora AI Video Burns 1 Kilowatt Hour and Emits 466 Grams of Carbon. And for What, Exactly?" reclaimedsystems.substack.com. (Independent cost-based estimate: ~0.94 kWh, ~4 L, ~466 g CO₂ per 10-second Sora-2 clip.)
Amazon Web Services. 2026. "Amazon Data Center Water Usage." June 10, 2026. aboutamazon.com. (First absolute disclosure: 2.5 billion gal / 9.46 billion L withdrawn 2025; WUE 0.12 L/kWh; ~⅔ returned. Reported by Data Center Dynamics and Latitude Media.)
Altman, Sam. 2025. "The Gentle Singularity." Personal blog, June 2025. https://blog.samaltman.com/the-gentle-singularity. (0.34 Wh and 0.000085 gal per average ChatGPT query; no methodology provided. Reported with caveats by Data Center Dynamics.)
Anthropic. 2025–26. "How Do Usage and Length Limits Work?" Claude Help Center. https://support.claude.com/en/articles/11647753-how-do-usage-and-length-limits-work.
atmosfair. n.d. "Flight CO₂ Calculator & Climate Impact Methodology." Accessed June 2026. https://www.atmosfair.de/en/offset/flight/.
Bloomberg News. 2025. "The AI Boom Is Draining Water From the Areas That Need It Most." https://www.bloomberg.com/graphics/2025-ai-impacts-data-centers-water-data/.
Cambridge Centre for Alternative Finance. 2025. "Cambridge Bitcoin Electricity Consumption Index & Digital Mining Industry Report." University of Cambridge. Accessed June 2026. https://ccaf.io/cbnsi/cbeci.
Carbon Brief. 2025. "AI: Five Charts That Put Data-Centre Energy Use — and Emissions — Into Context." https://www.carbonbrief.org/ai-five-charts-that-put-data-centre-energy-use-and-emissions-into-context/.
Carbon Trust. 2021. "Carbon Impact of Video Streaming." https://www.carbontrust.com/our-work-and-impact/guides-reports-and-tools/carbon-impact-of-video-streaming.
Couch, Simon P. 2026. "Electricity Use of AI Coding Agents." January 20, 2026. https://simonpcouch.com/blog/2026-01-20-cc-impact/. (Median coding-agent session ≈ 41 Wh ≈ 138 typical chat queries; heavy multi-agent workday ≈ 1.3 kWh ≈ one dishwasher run.)
Crawford, Neta. 2019. "Pentagon Fuel Use, Climate Change, and the Costs of War." Watson Institute for International and Public Affairs, Brown University. https://watson.brown.edu/costsofwar/papers/ClimateChangeandCostofWar.
de Vries, Alex. 2023. "The Growing Energy Footprint of Artificial Intelligence." Joule 7 (10): 2191–94. https://www.cell.com/joule/fulltext/S2542-4351(23)00365-3.
de Vries-Gao, Alex. 2025. "The Carbon and Water Footprints of Data Centers and What This Could Mean for Artificial Intelligence." Patterns, December 17, 2025. https://www.cell.com/patterns/fulltext/S2666-3899(25)00278-8.
EPA (Environmental Protection Agency). 2024. "Greenhouse Gas Emissions from a Typical Passenger Vehicle." Accessed June 2026. https://www.epa.gov/greenvehicles/greenhouse-gas-emissions-typical-passenger-vehicle. See also EPA WaterSense, "Showerheads" https://www.epa.gov/watersense/showerheads and "Residential Toilets" https://www.epa.gov/watersense/residential-toilets (WaterSense flush 1.28 gal ≈ 4.8 L; older fixtures to ~26 L; full bathtub ≈ 70 gal ≈ 265 L).
Google. 2025. "Measuring the Environmental Impact of AI Inference." Google Cloud Blog, August 2025. https://cloud.google.com/blog/products/infrastructure/measuring-the-environmental-impact-of-ai-inference/. (Covered critically by MIT Technology Review and Towards Data Science.)
Google. 2025. Environmental Report 2025. https://sustainability.google/google-2025-environmental-report/.
Han, Yuelin, et al. (UC Riverside / Caltech; Shaolei Ren group). 2024. "The Unpaid Toll: Quantifying the Public Health Impact of AI." arXiv:2412.06288. https://arxiv.org/abs/2412.06288. (US data-centre public-health burden >$20 B/yr by 2028; per-household costs up to 200× higher in the most-affected, disproportionately disadvantaged counties.)
Google. 2026. "Google's Training Supercomputers from TPU v2 to Ironwood: Architectural Stability, Scale, Resilience, Power Efficiency, and Sustainability Across Five Generations." arXiv:2606.15870. arxiv.org/abs/2606.15870. (Performance-per-watt and carbon-per-FLOP gains across five TPU generations — the hardware basis of the per-prompt efficiency curve.)
International Energy Agency. 2025. Energy and AI (World Energy Outlook Special Report). April 2025. https://www.iea.org/reports/energy-and-ai.
International Energy Agency. 2025–26. Key Questions on Energy and AI & "Data Centre Electricity Use Surged in 2025." https://www.iea.org/reports/key-questions-on-energy-and-ai/executive-summary · news release.
Jegham, Nidhal, et al. 2025. "How Hungry Is AI? Benchmarking Energy, Water, and Carbon Footprint of LLM Inference." arXiv:2505.09598. https://arxiv.org/abs/2505.09598.
Kamiya, George / International Energy Agency. 2020. "The Carbon Footprint of Streaming Video: Fact-Checking the Headlines." https://www.iea.org/commentaries/the-carbon-footprint-of-streaming-video-fact-checking-the-headlines.
Koomey, Jonathan. n.d. "Wild Claims about Electricity Used by Computers That Just Won't Die (But Should)." https://www.koomey.com/koomey_blog/wild-claims-about-electricity-used-by-computers-that-just-wont-die--but-should-/.
Li, Pengfei, Jianyi Yang, Mohammad A. Islam, and Shaolei Ren. 2025. "Making AI Less 'Thirsty': Uncovering and Addressing the Secret Water Footprint of AI Models." Communications of the ACM 68 (7); arXiv:2304.03271 (2023). https://cacm.acm.org/sustainability-and-computing/making-ai-less-thirsty/.
Luccioni, Alexandra Sasha, Yacine Jernite, and Emma Strubell. 2024. "Power Hungry Processing: Watts Driving the Cost of AI Deployment?" In Proceedings of the 2024 ACM Conference on Fairness, Accountability, and Transparency (FAccT '24), 85–99. https://dl.acm.org/doi/10.1145/3630106.3658542.
Luccioni, Sasha, et al. 2025. "Misinformation by Omission: The Need for More Environmental Transparency in AI." arXiv:2506.15572. https://arxiv.org/abs/2506.15572. See also Luccioni's disclosure comparison: "What Kind of Environmental Impacts Are AI Companies Disclosing?"
Macknick, Jordan, Robin Newmark, Garvin Heath, and K. C. Hallett. 2012. "Operational Water Consumption and Withdrawal Factors for Electricity Generating Technologies: A Review of Existing Literature." Environmental Research Letters 7 (4): 045802. https://iopscience.iop.org/article/10.1088/1748-9326/7/4/045802.
Masanet, Eric, Arman Shehabi, Nuoa Lei, Sarah Smith, and Jonathan Koomey. 2020. "Recalibrating Global Data Center Energy-Use Estimates." Science 367 (6481): 984–86. https://www.science.org/doi/10.1126/science.aba3758.
Mekonnen, Mesfin M., and Arjen Y. Hoekstra. 2012. "A Global Assessment of the Water Footprint of Farm Animal Products." Ecosystems 15: 401–415. https://doi.org/10.1007/s10021-011-9517-8. See also Water Footprint Network, Product Gallery (coffee ≈ 140 L/cup; 150 g beef burger ≈ 2,350 L; 150 g soy burger ≈ 160 L).
Mills, Evan, et al. 2019. "Toward Greener Gaming: Estimating National Energy Use and Energy Efficiency Potential." The Computer Games Journal 8: 157–78. Lawrence Berkeley National Laboratory "Green Gaming" project. https://greengaming.lbl.gov.
O'Donnell, James, and Casey Crownhart. 2025. "We Did the Math on AI's Energy Footprint. Here's the Story You Haven't Heard." MIT Technology Review, May 20, 2025. https://www.technologyreview.com/2025/05/20/1116327/ai-energy-usage-climate-footprint-big-tech/. (Measured ≈ 0.94 kWh per 5-second CogVideoX-class video generation.)
Microsoft. 2025. 2025 Environmental Sustainability Report. May 29, 2025. https://blogs.microsoft.com/on-the-issues/2025/05/29/environmental-sustainability-report/.
Mistral AI. 2025. "Our Contribution to a Global Environmental Standard for AI." July 2025. https://mistral.ai/news/our-contribution-to-a-global-environmental-standard-for-ai/. (ADEME/Carbone 4-audited LCA of Mistral Large 2: 20.4 ktCO₂e and 281,000 m³ water over training + 18 months of use; 1.14 g CO₂e and 45 mL water per 400-token response.)
Parkinson, Stuart, and Linsey Cottrell. 2022. Estimating the Military's Global Greenhouse Gas Emissions. Scientists for Global Responsibility & Conflict and Environment Observatory. https://ceobs.org/estimating-the-militarys-global-greenhouse-gas-emissions/.
Patterson, David, et al. 2021. "Carbon Emissions and Large Neural Network Training." arXiv:2104.10350. https://arxiv.org/abs/2104.10350.
Poore, Joseph, and Thomas Nemecek. 2018. "Reducing Food's Environmental Impacts through Producers and Consumers." Science 360 (6392): 987–92. https://doi.org/10.1126/science.aaq0216.
Potter, Brian. 2025. "I Was Wrong About Data Center Water Consumption." Construction Physics. https://www.construction-physics.com/p/i-was-wrong-about-data-center-water.
Ritchie, Hannah. 2024–25. "What Share of Global CO₂ Emissions Come from Aviation?" Our World in Data. https://ourworldindata.org/global-aviation-emissions. And "What's the Carbon Footprint of Using ChatGPT or Gemini? [August 2025 Update]." https://hannahritchie.substack.com/p/ai-footprint-august-2025.
SemiAnalysis. 2026. "From Tokens to Burgers — A Water Footprint Face-Off." March 2026. https://newsletter.semianalysis.com/p/from-tokens-to-burgers-a-water-footprint.
Southern Environmental Law Center / NAACP / Earthjustice. 2025–26. "Elon Musk's xAI Threatened with Lawsuit over Air Pollution from Memphis Data Center" and "NAACP Asks Court for Emergency Action to Stop Illegal Air Pollution from xAI's Data Center Power Plant." selc.org · earthjustice.org.
Shehabi, Arman, et al. 2024. 2024 United States Data Center Energy Usage Report. Lawrence Berkeley National Laboratory, December 2024. https://eta-publications.lbl.gov.
Staples, Andy / Driving the Green. 2023. "Can Golf Courses Achieve a 'Real Zero' Carbon Footprint?" (CarbonSave® Calculator, GCSAA 2015 medians.) https://www.drivingthegreen.golf/dtg-blog/can-golf-courses-achieve-a-real-zero-carbon-footprint.
Tidåker, Pernilla, et al. 2017. "Energy Use and Greenhouse Gas Emissions from Turf Management of Two Swedish Golf Courses." Urban Forestry & Urban Greening. https://www.sciencedirect.com/science/article/pii/S1618866716302692.
United Nations University (UNU-INWEH). 2026. Environmental Cost of Artificial Intelligence: Carbon, Water and Land Footprints. June 2026. unu.edu/inweh. (Projects ~945 TWh and ~399 Mt CO₂ by 2030 and up to 2.5 Mt AI e-waste/yr; environmental-justice framing.)
US Department of Defense. 2023. Plan to Reduce Greenhouse Gas Emissions. https://media.defense.gov.
USGA (United States Golf Association). 2012. "How Much Water Does Golf Use and Where Does It Come From?" https://www.usga.org.
Wang, Peng, Ling-Yu Zhang, Asaf Tzachor, et al. 2024. "E-Waste Challenges of Generative Artificial Intelligence." Nature Computational Science 4: 818–23. https://www.nature.com/articles/s43588-024-00712-6.
Wynes, Seth, and Kimberly A. Nicholas. 2017. "The Climate Mitigation Gap: Education and Government Recommendations Miss the Most Effective Individual Actions." Environmental Research Letters 12 (7): 074024. https://doi.org/10.1088/1748-9326/aa7541.
You, Josh. 2025. "How Much Energy Does ChatGPT Use?" Epoch AI Gradient Updates, February 2025. https://epoch.ai/gradient-updates/how-much-energy-does-chatgpt-use.
Six sentences that survive fact-checking, portable in either direction. Each chevron opens the receipt.
50 queries/day × 365 × 0.03–0.4 g CO₂e ≈ 0.5–7 kg/yr vs ~105 kg per 12-gallon tank. Sources: Google 2025 (measured median); Jegham et al. 2025 (independent benchmark); EPA.
WaterSense flush 4.8 L vs 50 median prompts/day × 30 days × 0.26 mL ≈ 0.4 L. Sources: EPA WaterSense; Google 2025. (At full-lifecycle accounting — 45 mL/response, Mistral 2025 — the flush still covers ~2 days.)
~11.3 kWh/min (MIT TR 2025, measured) ⇒ 2–5 kg CO₂e vs a burger's 5–9 kg (Poore & Nemecek 2018). In water the burger wins 15–400×: same pair of objects, inverted ranking — always ask which molecule.
Per-prompt −33× in twelve months (Google 2025) vs total ambition-based emissions +51% over 2019 (Google ER 2025). Jevons' paradox: efficiency lowers the price of intelligence; demand multiplies past the savings.
Bloomberg 2025 (WRI/DC Byte data): ~⅔ of new US data centres since 2022 in high water-stress regions. Aggregate US data-centre water is ~3% of golf irrigation (LBNL; USGA) — but aquifers are local, not aggregate.
Google (measured methodology, Aug 2025) and Mistral (ADEME/Carbone 4 LCA, Jul 2025). OpenAI and Anthropic publish no standalone audited footprint; no one discloses video, reasoning, or agentic workloads (Luccioni 2025; Luccioni et al. 2025). Whatever side you argue, disclosure is your friend.
All works and media on Glia.ca by David Jhave
Johnston
are licensed under CC
BY-NC-SA 4.0.
Jhave is currently an AI-narrative researcher at the UiB Centre for Digital
Narrative (2023–27) with the Extending Digital Narrative project.
This work was partially supported by the Research Council of Norway through its Centres of Excellence scheme,
project number 332643 (Center for Digital Narrative), and its SAMKUL project scheme, project number 335129
(Extending Digital Narrative).