
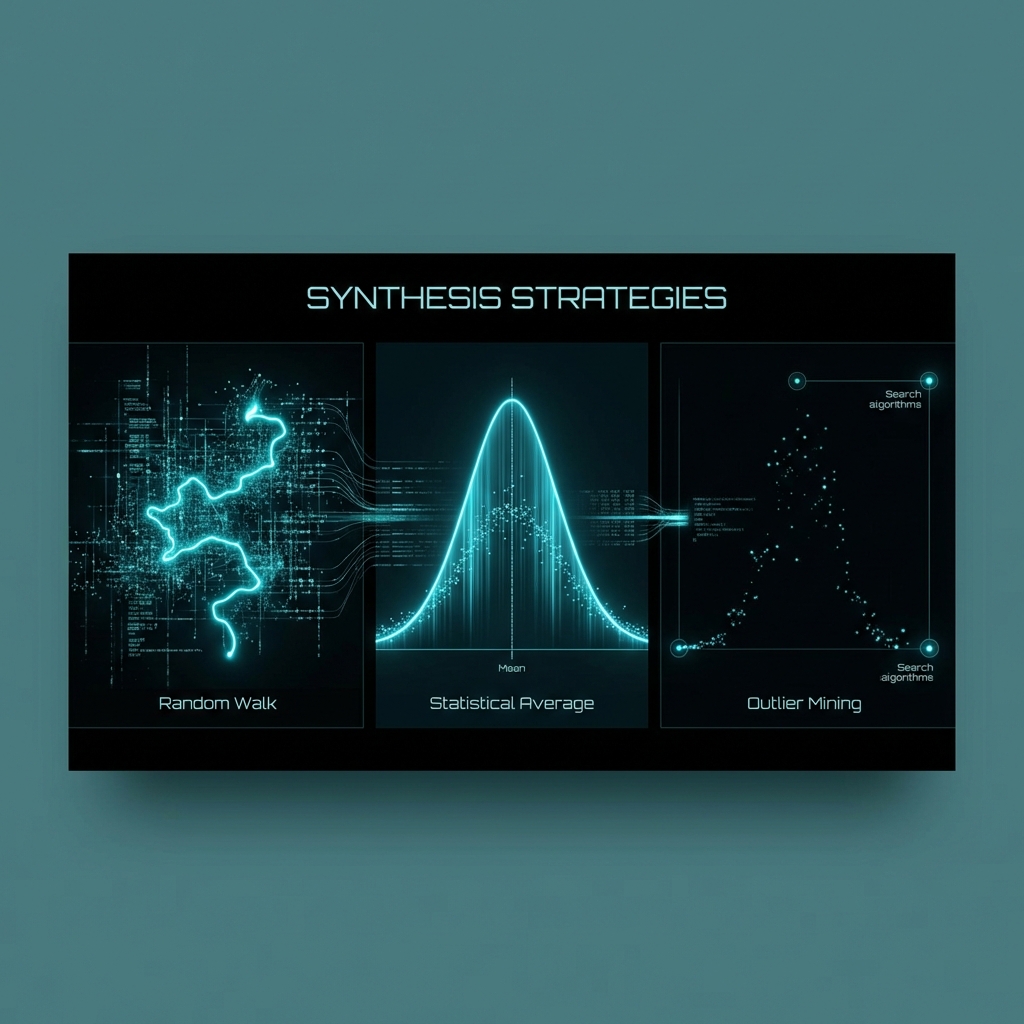
Three computational approaches for transforming anonymized health data into narrative structures, each creating different character types and storytelling possibilities.
Random Walks
Generate outlier characters by selecting non-normative data combinations. Creates dramatic, memorable individuals who defy expectations.
Statistical Averaging
Build archetypal characters from mean values and common trajectories. Represents the "average" Norwegian experience.
Outlier Mining
Identify statistically rare but real combinations. Characters live at the edges of distribution, revealing system boundaries.
Strategy 1: Random Walk Through Data Space
Begin with a random seed point in the data (e.g., Female, born 1963, rural municipality). At each life stage, randomly select from plausible next states weighted by actual HUNT transition probabilities. This creates characters who follow realistic but non-deterministic paths—like a person making choices within statistical constraints.
Best for: Interactive installations where viewers want to encounter different stories each time. Characters feel unique and surprising while remaining believable.
Random Walk Character Example: Ingrid, born 1968 in rural Trøndelag. Average BMI in her 20s, but unusually high physical activity (outlier). Married at 24 (typical), but divorced at 39 (transition). Developed depression at 42 (correlated with divorce). Started smoking at 45 (atypical—most start younger). Income dropped to lowest quintile at 47. Quit smoking at 52 after diabetes diagnosis. Remarried at 56 (rare second chance). Current state: moderate health, stable income, high life satisfaction. Her path includes both typical transitions and unusual choices, creating narrative tension.
Strategy 2: Averaging for Generic Continuity
Calculate mean values across cohorts matched by age, sex, and birth decade. Build "composite" characters who embody the statistical center of their demographic group. These avatars speak for a generation, representing collective experience rather than individual variation.
Best for: Establishing baseline understanding of Norwegian health experience. Useful for museum visitors to recognize familiar patterns and see themselves reflected in aggregate data.
Averaged Character Example: Bjørn represents the mean values of men born 1955-1965 in Nord-Trøndelag. BMI 25.3 at age 30, rising to 27.8 by age 60. Married once, at age 28. Two children. Completed secondary education. Income: middle quintile throughout life. Smoked from age 20-45, quit due to health concerns. Moderate alcohol consumption. Developed hypertension at 58, managed with medication. Retired at 67. Self-rated health: "good" declining to "fair" after 60. Bjørn is unremarkable—and that's the point. He embodies the generic Norwegian male health trajectory, a statistical everyman.
Strategy 3: Outlier Mining for Dramatic Narratives
Identify real data points that fall outside 2-3 standard deviations from mean values. These are the statistical "extremes"—people who live at the boundaries of health distributions. Their stories reveal system stresses, rare outcomes, and the limits of population norms.
Best for: Creating memorable, emotionally resonant characters who challenge assumptions and provoke deeper reflection on health inequalities and individual variation.
Outlier Character Example: Astrid, born 1972. University-educated (top 20% for her cohort), but lives in remote rural area (unusual). BMI 18.5 (underweight, persistent). Never married (rare for her generation). Very high physical activity levels (top 5%). Zero alcohol consumption. Developed severe depression at 35 with multiple episodes (top 10% severity). Receives disability pension at 43 due to mental health (uncommon for her education level). Participates in all HUNT surveys despite isolation (outlier engagement). Astrid's profile combines privilege (education) with adversity (mental health, isolation) in statistically improbable ways, creating narrative complexity.
Combining Strategies
The most powerful narrative installations will combine all three strategies. Averaged characters provide the baseline for comparison, helping visitors understand typical Norwegian health trajectories. Random walk characters introduce variability and unpredictability, showing how individual choices create unique paths within statistical constraints. Outlier characters create emotional resonance and memorable encounters, challenging assumptions about what "normal" health looks like. Together, these approaches span the full distribution of health experiences captured in 35 years of HUNT data, from the statistically ordinary to the remarkably exceptional.